Reports
Reports - Product Report Guide
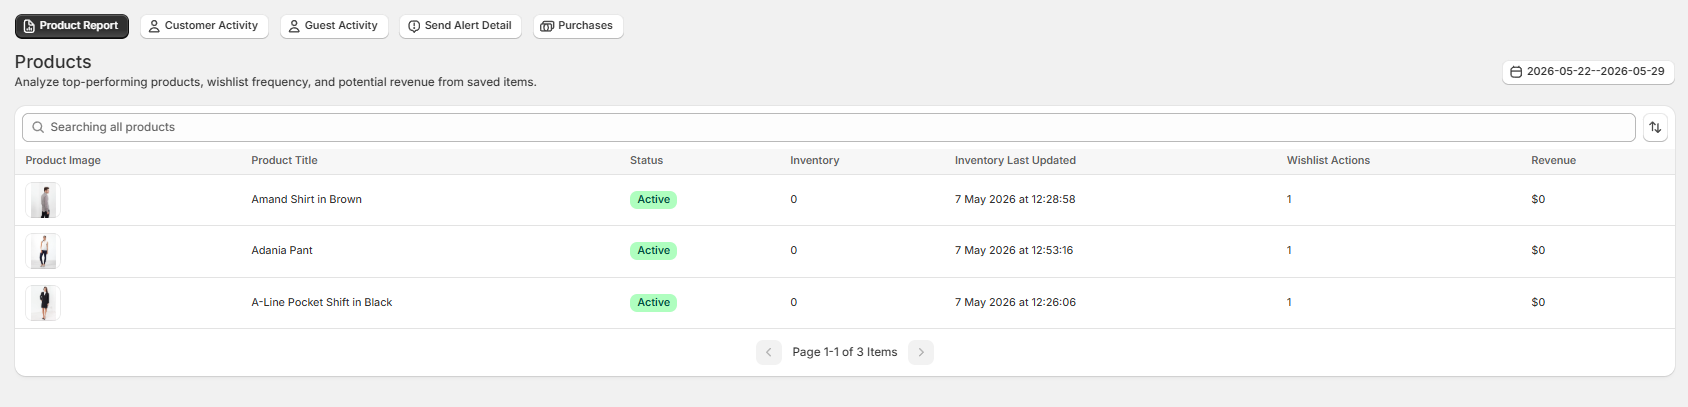
Analyze your top-performing products, wishlist frequency, and the potential revenue generated from items saved by your customers.
1. Navigating the Product Report Table
This data table tracks detailed metrics for every item added to a user's wishlist across your store.
- Product Image & Title: Displays the product thumbnail and exact name (e.g., Amand Shirt in Brown, Adania Pant) for quick visual identification.
- Status: Shows the current visibility status of the product in your Shopify catalog (e.g., Active).
- Inventory: Displays live stock levels directly from your Shopify admin panel.
- Inventory Last Updated: Provides a precise timestamp showing exactly when the product's inventory level was last synced with the app database.
- Wishlist Actions: Tracks the total cumulative number of times this specific item has been saved across all customer wishlists.
- Revenue: Measures the total absolute dollar value generated from checkouts containing this product after being added via a wishlist trigger.
2. Global Table Controls
- Search Bar: Type any keyword into the "Searching all products" field to instantly filter your item catalog.
- Date Range Picker: Filter all historical metrics by your preferred dates to analyze specific performance cycles.
- Pagination: Use the bottom navigation arrows to flip through your item catalog screens cleanly.