Analytics
Analytics Guide
Track engagement metrics, evaluate store conversion rates, and discover high-intent items using your analytics dashboard. Use these data metrics to analyze consumer interest patterns over selected timeframes.
1. Status Banners & Plan Usage
The top portion of your dashboard keeps track of active initialization dependencies and app data limits:
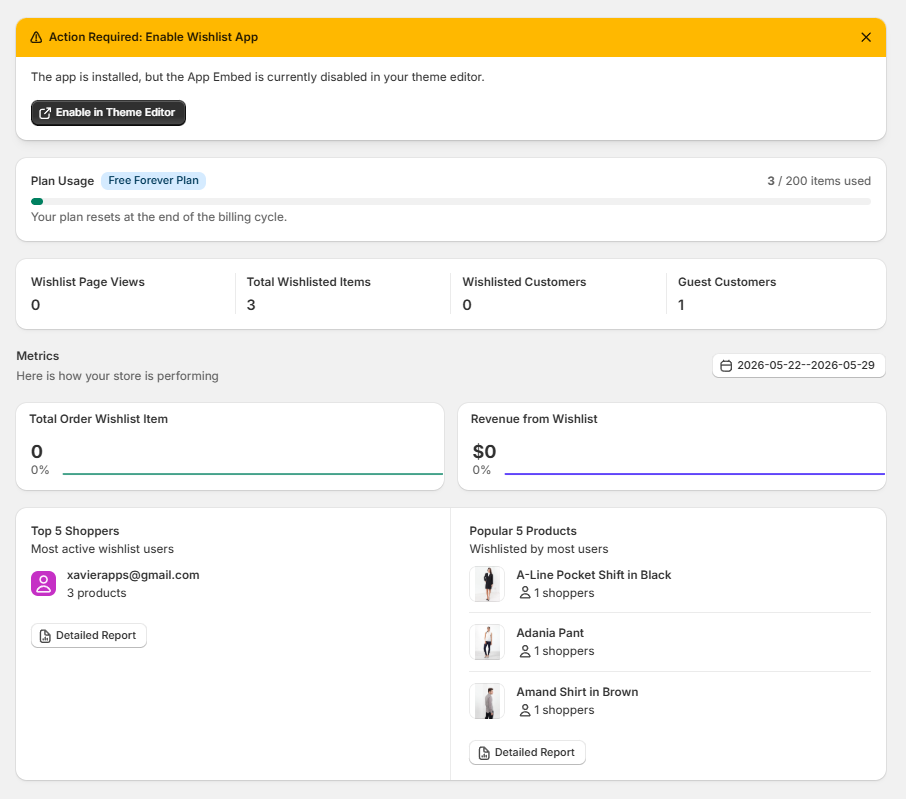
- Action Required Warning: If your main scripts are inactive on your frontend theme, a yellow notice block ("Action Required: Enable Wishlist App") will prompt you. Click "Enable in Theme Editor" to jump straight to your live theme options and resolve it.
- Plan Usage Progress: Displays your active structural tier (e.g., Free Forever Plan) and tracks your exact calculation quota usage metrics (e.g., 3 / 200 items used) alongside an integrated horizontal capacity bar.
2. Core Operational Metrics
This centralized panel shows a four-column breakdown of immediate visitor wishlist activity:
- Wishlist Page Views: Tracks how many total times shoppers have opened or loaded your dedicated wishlist layout view.
- Total Wishlisted Items: The absolute quantity of active product units saved across all combined customer lists.
- Wishlisted Customers: The total number of recognized, registered, or logged-in accounts utilizing your wishlist features.
- Guest Customers: The quantity of anonymous, non-logged-in visitors utilizing your local storage browser-session wishlist tracking features.
3. Performance & Store Revenue
Evaluate conversions generated by your active wishlist flows:
- Date Range Filter: Click the calendar control to focus your metrics on precise analysis cycles (e.g., 2026-05-22--2026-05-29).
- Total Order Wishlist Item: Tracks the absolute number of items purchased specifically after being saved into a user's wishlist folder, alongside a percentage growth modifier line.
- Revenue from Wishlist: Displays the direct dollar amount ($) added to your sales channel checkout conversions through customer wishlists.
4. Consumer Rankings & Product Affinity
Discover your most engaged buyers and trending products using these structured leaders boards:
A. Top 5 Shoppers
- Identifies your absolute highest-intent user segments by list sizes.
- Displays account identifiers (e.g., xavierapps@gmail.com) alongside their absolute item counts (e.g., 3 products).
- Click "Detailed Report" to open a comprehensive analysis spreadsheet tracking deep customer behaviors.
B. Popular 5 Products
- Ranks your store items based on high-intent data mapping.
- Displays product imagery thumbnails, titles (e.g., A-Line Pocket Shift in Black, Adania Pant, Amand Shirt in Brown), and distinct user calculation totals (e.g., 1 shoppers).
- Click "Detailed Report" to load a full spreadsheet view of your complete product demand analytics.